The Hashtag Follow Model
The hashtag follow_model is one in which an agent follows another based on hashtags present in tweets. A hashtag is a searchable tag attached to signal contents, in Twitter similar to #topic_of_interest.
Constructing The Network
In order for this follow method to be possible, set:
- follow_model: hashtag
- 'use_hashtag_probabilty' must be greater than zero.
- adjust agent_types hashtag_follow_options to care_about_ideology: true
- for this tutorial only, change 'Celebrity' add: 0.0
Let's run a hashtag follow model simulation. We start with the INFILE.yaml we created in Tutorial 6 and save it to /hashtag/docs/tutorial_input_files/tutorial07/INFILE.yaml. This tutorial should take approximately 15 minutes to complete.
We will let the use_hashtag_probability remain at 0.5 so that 50% of the tweets will contain the hashtags necessary.
The agent_types section have hashtag_follow_options, where agent preferences with regards to hashtags may be set, by marking 'true' for care_about_region and/or care_about_ideology respectively.
For this simulation, we will have agents follow agents that share the same ideology, so we input 'true' for care_about_ideology and have care_about_region remain 'false'.
For simplicity, we will also remove any 'Celebrity' agents from this network simulation by changing the 'Celebrity' add weight to 0.0.
hashtag_follow_options:
  care_about_region: false # does the agent care about where the agent they will follow is from?
  care_about_ideology: true # does the agent care about the ideology of the agent they will follow?
Running and Visualizing The Network
Creating a network with this configuration, we produced the following visualization in Gephi using the 'Yifan Hu' and 'Contraction' layouts:
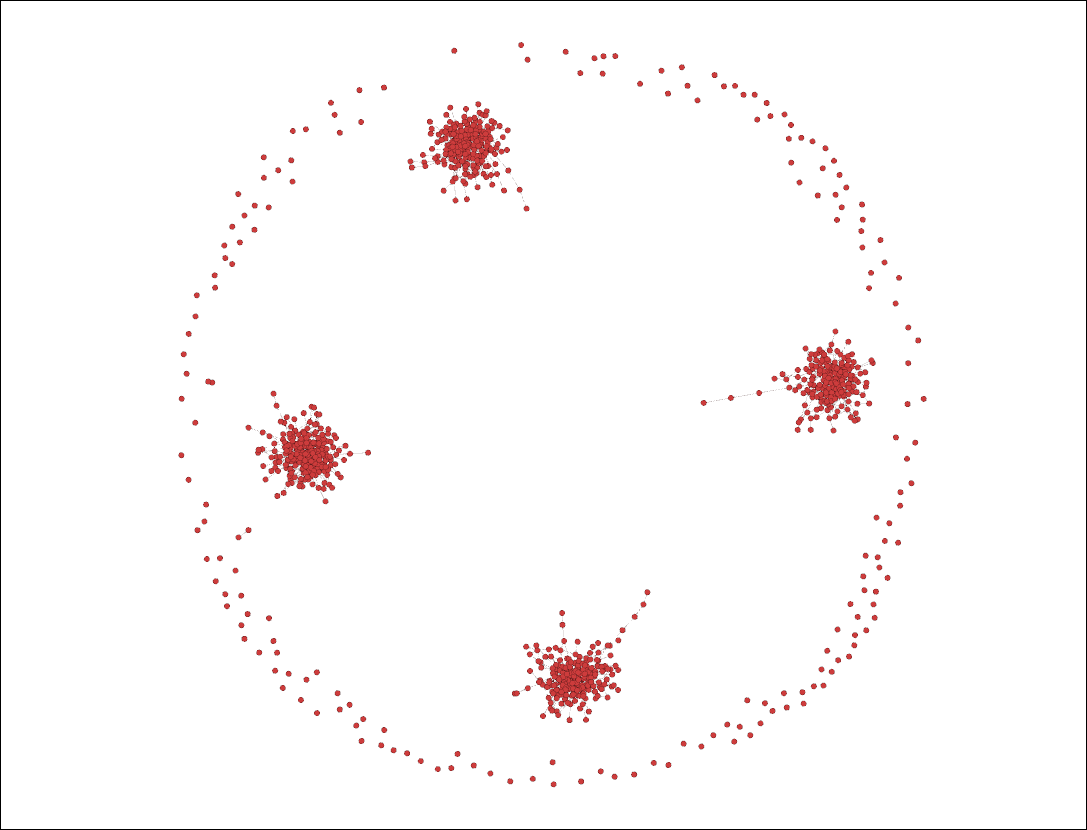
As you can see from this visualization, agents are separated into 4 main groups, with several other agents having no connections. These 4 groups correspond to the 4 different ideologies we have in our network, named 'Red', 'Blue', 'Green', and 'Orange'. Note that the colours of agents in the visualization do not correspond to ideology colours.
A plot of the cumulative-degree distribution of these agents is shown below:

As expected given the number of unconnected agents in this network, there are either agents with a very low degree or high degree in this network, though there are much more agents with a low degree.
The commands used to create this graph in Gnuplot were:
set style data linespoints
set title 'Cumulative-Degree Distribution'
set xlabel 'Cumulative-Degree'
set ylabel 'Normalized Cumulative-Degree Probability'
plot 'cumulative-degree_distribution_month_000.dat' title ''
We can also plot the tweet distribution through use of the tweets_distro.dat file.

As we can see from this plot of the tweet distribution, most agents have made 1 to 6 tweets in this simulation. Most agents make few tweets, and a few agents make many tweets.
The commands used to create this graph in Gnuplot were:
set boxwidth 0.75
set style fill solid 0.5
set xrange[0:]
set title 'Tweet Distribution'
set xlabel 'Number of Tweets'
set ylabel 'Normalized Probability of Agents with that Many Tweets'
plot 'tweets_distro.dat' with boxes title ''
Next Steps
You have now gained experience with the hashtag follow model. You are encouraged to try experimenting with this follow model by implementing more regions and ideologies into your network simulations, as well as several agent types with differing hashtag_follow_options and tweet rates. Doing so is bound to lead to some fascinating results. When you feel you are ready, move on to the next tutorial, where we will discuss the final follow model, the twitter follow model, which incorporates all of the other follow models into a network simulation.